Some thoughts on additional services OrderAhead should provide.
Read More
Why Google Glass Will Fail
Google Glass Will Fail.
Note: A lot of the ideas here came from a conversation I had with Greg Schlomoff. We were talking about the impact Google has had on the world versus Facebook, which lead to a conversation about Google Glass.
Call me short sighted, but I really don’t think there’s much of a future for Google Glass or the new Pulse by Withings.
Why you ask? Well, that’s easy:
Google Glass forces me to adopt a new device, instead of replacing an old one.
I don’t wear glasses. I don’t carry a small 8 gram rectangular device to clip onto my belt. I carry a phone, I sometimes wear a watch, and I wear a belt. I don’t wear any bracelets, I don’t wear glasses.
If you want me to start carrying a new device, you have to offer me an incredible value proposition, that none of my current devices offer. In the case of Google glass, it does may of the same things my cell phone does, but it doesn’t REPLACE my cell phone.
If it made glasses better (for those who wore them), then it would have a significant value proposition for that demographic. Problem is…people who wear glasses can’t wear Google Glass. The one demographic they could have gotten traction with, they cut out of their beta.
It’s not a micro improvement on something we already use, it’s a completely new device.
The iPhone worked because it created an incremental improvement around the user experience of telephones. Smart Phones already existed, people were already using portable devices as joint telephones and computing devices. (Ah, the ol’ Palm Pilot. I miss it at times). What Apple did is it created a device that enabled you to interact with it in a differentiated manner (the swipe touchscreen), with a powerful user experience around their apps, their unique operating system.
It even cannibalized a very important part of its business: The iPod. It effectively integrated the iPod into a the phone, and made it so we had to carry one less device in our lives.
The iPhone made what I already had in my pocket, so much better.
If Glass, or Pulse, or any of these wearable device companies truly wanted to get early adoption, they’d focus on creating devices that replace any items I currently have. Why not create a watch or a belt or belt buckle?
I don’t buy the efficiency argument.
The argument is that it will make it so I don’t have to pull out my phone every time I want to do something. Fair enough. Is that a really big pain point though? Do I complain every time I have to pull out my phone to take a picture? No - I don’t. There have been maybe two occasions in my entire life where I missed a cool picture because I couldn’t whip my phone out fast enough. That opportunity cost doesn’t justify adding the burden of glasses to my face permanently.
The feedback I keep hearing from people is that the user experience is awkward. The tilt your head back + voice command platform is disruptive, and somewhat antisocial. If efficiency was one of the maind rivers of adoption, they should have focused more intently on the user experience of Glass. Bad UX doesn’t translate to a more efficient platform, no matter how manys teps were cut.
Additionally, The cost of adding something to my face significantly outweighs the benefits of efficiency.
It’s a physical barrier between the wearer and the world
I feel this every time i talk to someone who has Google Glasses on. IT’s hard to explain, but I feel like there’s a barrier between us - I wonder if they’re going to interact with Glass at some point and do something in the middle of our conversation. It feels like they have their phone out, and they’re about to make a call, but are trying to talk to me at the same time - I’m not sure whether our conversation should be brief, or if I should be trying to meaningfully engage with the person.
Some people also seem to feel threatened by Google Glass. They wonder if they’re being recorded, and they feel like the tool could be used against them in some way.
As Greg put it, Google Glass is the equivalent of flying cars, We’ve had flying cars for some time now, but they haven’t been adopted. It’s one of those things that sounds cool to us nerds, but is wholly unpractical.
Now, you could argue that some of the arguments made above will simply go away as we get accustomed to interacting with Glass (both as wear-ers and outsiders). I don’t think that’s right. I think the culmination of all of these negatives significantly outweighs the benefits Glass adds to our lives, and that they will keep Glass from being adopted.
Google Glass will add a significant burden to my life, and it’s unclear what the advantages are. I’m going to look weird. I don’t wear glasses. It’s not replacing anything, it’s going to be IN ADDITION to what I have. With google glass I’m going to have two ways to take pictures, two ways to see if I have any new messages, two ways to do X. It may do some things better than my phone, but it isn’t replacing my phone.
If it replaced my watch, however, that would be a different story. IT’s easy to add a lot of value veyond telling time, and I think I’m ready for a new watch anyways.
Your First Pitch Deck
Guide on how to write your first pitch deck for venture capital investors.
Read More
Closing Your Round =! Product to Market Fit
Pitfalls I made after I closed our seed round.
Read More
Fundraising Makes You Fat
Overview of the pressures fundraising brings to startups. I outline the propensity to overbuild and overplan as the two biggest ones in tech startups.
Read More
Apologizing to Chris Dixon - This is How It's Done.
Chris Dixon just wrote a brief blog post titled "Seriously, what’s up with old media not crediting bloggers? "
I immediately started digging into the situation to see how bad the violation was and if anything had been done about it. Turns out that the violation was indeed bad - the sentence structure and thought line was nearly identical.
The part of the story that isn't being shared is how quickly Josh Linkner (the "plagiarist" in this case) admitted his mistake publically, offered to discuss what happened with Chris Dixon, and corrected the article to rerflect the source.
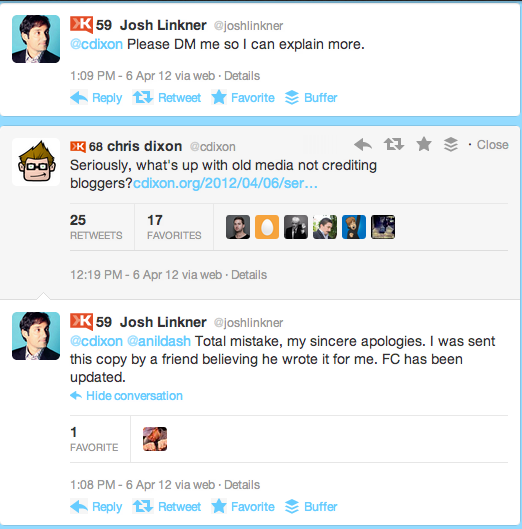
That's impressive. As you can see above, Josh did all of this within an hour.
Hat off to Josh - he made an honest mistake it seems like, and quickly rectified the error.
SXSW Launch: You're Doing It Wrong
Tips on how to prep for your SXSW launch
Read More
Collapsing Revenue Metrics - Skyrocketing Costs = Groupon's Disaster
“We have experienced rapid growth over a short period in a new market that we have created and we do not know whether this market will continue to develop or whether it can be maintained. If we are unable to successfully respond to changes in the market, our business could be harmed.” – Groupon’s S-1 Filing
Yeah, we’ve all bought a Groupon to get a nice(r) haircut, or a good massage…but that doesn’t mean Groupon’s IPO is something we should be excited about.
In reality, Groupon has become nothing more than a get rich scheme for the founders and the venture capitalists backing them. They had a first mover advantage that has completely eroded – they will soon be a lackluster business with no margins.
Here’s Why:
Quick Glance at their Subscribers and Revenue between 2008 and 2010:
|
|
2009 |
2010 |
Growth |
|
Revenues |
$30,471,000 |
$713,365,000 |
23.4x |
|
Subscribers |
1,807,278 |
50,583,805 |
28.0x |
|
Groupon's Sold |
2,695 |
66,289 |
24.6x |
|
Featured Merchants |
1,248,792 |
30,296,070 |
|
|
|
|
|
|
|
Revenues/Subscriber |
$17 |
$14 |
|
|
Revenue/Feat. Merch. |
$11,306 |
$10,761 |
|
|
Revenue/Groupon |
$24 |
$24 |
|
As we can see, their subscriber growth has been outstanding, growing from a base of 1.8 million in 2009 to more than 50.5 million in 2010 and 83 million at the end of Q1 2011. I’m pretty sure this makes Groupon the fastest growing company (in terms of user growth) in modern history. Impressive is an understatement. Without any analysis, the revenue number looks equally impressive, showing a 23.4x growth in one year.
Red Flags Remain:
Despite this rosy initial picture, red flags are everywhere….Upon closer investigation, I have found that their “Revenue / Groupon Sold “ has remained intact at $24. (NOTE: THIS IS A CORRECTION MADE ON JUNE 6TH) A key part of their strategy is to increase the number of merchants offering deals every day, and then targeting those deals to individuals they believe would be most interested. They believe this helps box out other competitors from targeting those merchants, while simultaneously providing a more customized user experience for their subscribers. What has shrunk is their revenue per merchant, showing that as their customer and merchant acquisition costs go up (with a heavy salesforce), their revenue per deal is failling rapidly. (NOTE: Correction also added on June 6th)
Additionally, I have found that their “Revenue / Subscriber” has fallen from $17 to $14 , and as we will see below, is likely to continue to collapse.
Subscriber to Customer Conversion Rates Falling:
|
|
|
|
|
3 months ended March 31 |
|
|
|
2009 |
2010 |
|
2010 |
2011 |
|
Subscribers(1) |
1,807,278 |
50,583,805 |
|
3,434,610 |
83,100,006 |
|
Cumulative customers(2) |
375,099 |
9,031,807 |
|
874,017 |
15,803,995 |
|
Featured merchants(3) |
2,695 |
66,289 |
|
2,903 |
56,781 |
|
Groupons sold(4) |
1,248,792 |
30,296,070 |
|
1,760,398 |
28,094,743 |
Above is the subscriber, customer and sales data from Groupon’s S-1 Filing, for the years 2010 and 2011.
|
|
3 mos. Ending March 31 |
|
|
|
2010 |
2011 |
|
Subscriber to Customer Conversion |
25.4% |
19.0% |
|
Groupons Sold/Subscriber |
51.3% |
33.8% |
Taking the number of subscribers Groupon has and dividing it by its number of cumulative customers, we see that the subscriber to customer conversion is falling. In Q1 2010 more than 25% of Groupon’s subscribers had purchased a Groupon, while only 19% of subscribers had done so in 2011. This should worry public market investors as it indicates that each new subscriber the company acquires is less likely to make a purchase.
Subscriber Reach Out: Success?
Looking at the number of Groupons sold per subscriber, we see that in 2010 they average one Groupon for every 2 subscribers they had, and that number has collapsed to 33% in 2011, supporting the evidence cited above.
A key part of Groupon’s strategy to reach subscribers has been to eventually offer individually targeted deals. They believed that in doing so, subscribers will be more likely to convert to customers. In reality, the cost of maintaining a growing sales force of 3,500 people only causes to contribute to Groupon’s massive overhead costs. As demonstrated above, while this sales force has grown, their subscribers are less likely to purchase groupons, showing that this strategy has clearly backfired.
Furthermore, despite their subscriber base growth, their marketing expense has also been skyrocketing. Their marketing budget has gone from $163,000 in 2008 to more than $263 million in 2010.
No Longer The First Mover
Groupon no longer is a first mover in this market, and the low barriers to entry have made it easy for others to enter and erode their margins. Groupon’s customers are out for the best deal, and are likely to sign up for every single discount and coupon service in existence. Similar to the online travel search engine era of the early 2000’s, users held no loyalty towards the Expedias of the world, and instead scoured any and all sites for the best deal. The greatest weakness of Groupon is they defined the market and trained their customers to want the best deal out there, and as today has shown, sometimes that deal won’t be found on Groupon.
Potential Saves:
The first thing Groupon could do is find a model whereby buyers are rewarded with loyalty points for going through them. If I get 10$ off every third Groupon I buy, I’d be a lot more likely to checkout Groupon’s list of discounts before I check anyone else’s. The problem with this strategy is that it’s also easily replicated, and could perpetuate a pricing war with its competitors. For instance, if Groupon tries to offer a $10 discount for every 3rd Groupon one buys, it’s easy to predict that a site like LivingSocial will match or sweeten that offer.
Understanding this landscape, it becomes obvious that Groupon can survive only if it refocuses on innovation. There’s no doubt that Andrew Mason and his team have proven themselves to be visionaries, but the future of the company lies in their ability to innovate. Groupon Now is interesting, but LivingSocial rolled out an identical product within days of Groupon’s announcement.
Unsubstantiated Claims:
Merchant Problem: I think merchants are finding that the exposure is incredible, but that the customers they’ve acquired aren’t. The type of individual who pounces on a Groupon deal is one who is extremely price sensitive, and out to get the best deal. This is particularly problematic for high end services like spas and beauty parlors, where their key differentiation is service and not price. Over time, I believe we’ll start seeing more deals in specific verticals (like grocery stores), where they’re already competing on price, and are just trying to get more people through their doors to buy more goods.
Founder Cash Out: Peter Kafka correctly pointed out in his article that the vast majority of Groupon’s last round went directly to the founders as a cash pay out.
The founders cashed out not just because they wanted what’s best for the company, but also because they realized that the company wouldn’t be worth as much as it is forever. They are a smart team that discovered an amazing idea and executed relentlessly on it. The problem is that Groupon’s model has no barriers to entry, and they see the writing on the wall as clearly as we do.
The key to Groupon’s success will be to continue innovating in the space faster than their peers, which is difficult to do, at best, and impossible at worst.
Red Flags of LinkedIn's IPO
LinkedIn’s shares rose to $100 /share, up from their IPO price of $45 in less than 24 hours. My having a startup in this space has led many people to ask me what I think of LinkedIn – so I dug a little deeper to see what the excitement was all about. What I found was that there were a multitude of red flags, buried deep in the data they presented, and within the market place as a whole.
LinkedIn’s stock value is based on its discounted future cash flows, ergo; your guess is as good as anyone else’s. The two main assumptions driving the DCF model are (users) and (revenues/user), or simply stated:
(Users ) * (Revenue / User)
Based on this formula, LinkedIn’s investors believe growth projections will fall into one of three categories: massive user growth, massive revenue/user growth, or both.
I. User Growth Red Flags:
a) Young people aren’t joining LinkedIn…
LinkedIn seems to have the user acquisition side of the equation pretty well covered. (As we can see here) That having been said, I see a few things that concern me. The first issue is one of demographics. It is not clear that individuals in the 18-25 demographic are joining LinkedIn at the same rate that people in the 27-60 demographic did. Only 20.9% of LinkedIn’s users are 24 and under. (Source) I would argue that a lot of LinkedIn’s growth has stemmed from being an alternative to Facebook for the 27-60 age group. For example, my former boss at Bloomberg is on LinkedIn, but would never even consider joining Facebook.
b) Social and Professional Use Cases are Being Blurred Across Social Networks:
Facebook is no longer about simply “poking” that cutie you just met. The use cases for Facebook are evolving. Whereas Facebook was built as an inherently social tool, the lines of use are starting to become blurred. Recent studies have shown that 1 in 4 Facebook users, and 1 in 3 LinkedIn users use the platforms for “both personal and professional purposes.” I believe the number of people using social networking websites for both personal and professional purpose will only continue to grow, thus allowing Facebook to expand its former niche position among a wide swath of both the younger and older demographic. (Source)
II. Revenue/User Red Flags:
1) Did you know that the majority of LinkedIn users don’t use the site?
Advertising revenue online is based on how often the ads are seen, or clicked on. As per LinkedIn’s own admission in its S-1 filing: “the number of our registered members is higher than the number of actual members, and a substantial majority of our page views are generated by a minority of our members”. This hints at the fact that most people use LinkedIn as a public repository for their online resumes. Unless LinkedIn is able to build a stronger more relevant feature set for the majority of their users, the revenue they make per user on advertising may decrease as users aren’t coming back to the site.
2) 32% of LinkedIn’s revenue is ad driven – this is likely to collapse as they dilute the “quality” of their users for quantity.
|
Hiring |
Marketing |
Premium |
|
|
Percent Of Revenues |
30% |
32% |
38% |
|
Millions |
$16.47 |
$17.568 |
$20.862 |
|
Per User |
$ 0.23 |
$ 0.24 |
$ 0.29 |
|
Per User/Month |
$ 0.08 |
$ 0.08 |
$ 0.10 |
Source: LinkedIn S-1 Filing
Also, I believe that the amount they can capture per user is likely to diminish over time, as their user base won’t be as influential or affluent. Currently, their advertising spin relies on a Nielsen study that found that “U.S. visitors to our website represent more decision makers, have higher average household incomes and are comprised of more college or post graduates than U.S. visitors of many leading business websites. “ Once they begin to capture a greater user base both in the US and abroad, I believe it will also likely result in them having to compress the amount of revenue they can capture for each user.
III. Things to Watch Out For:
1) User Growth:
a. How fast are they acquiring new users, and where is this growth coming from? It’s important to see that LinkedIn is able to displace local competitors, as Facebook was able to do a few years ago. The key markets to watch include Germany (Xing) and France (Viadeo).
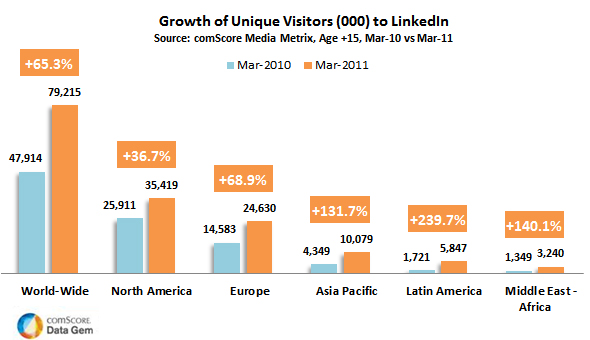
Of LinkedIn’s 100m users today, 44 million are in the United States, and 56 million are abroad. They’re seeing massive growth rates from Brazil (428% YOY growth), Mexico (178%), India (76%) and France (72%). As we can see in the infographic below, it seems that they have hit “escape velocity” with their user acquisition in key markets abroad, but itll be important that they maintain that in the near future.
b. How often are these users returning to the site? Keeping a close eye on monthly unique visitors and page views will be a good indicator of how often their new users are coming back to the site, and how much churn there is in old users. This will be a leading indicator of whether they could eventually make more ad dollars per user since they’d be getting more page views and repeat usage, and thus compensating for the dilution in the quality of the user.
2) Feature Set:
What features are they rolling out, and how are they impacting both the virality of the application, and the use cases for their users. It’s clear that the current feature set is powerful for people in Human Resources, and Sales. Outside of those two demographics, it’s not clear that LinkedIn is doing a good job of converting their users to paid services. Adding features could help them create a 4th, 5th or even 6th revenue stream that stabilizes their business and makes their service more defensible.
Acquisitions. There is a flurry of startups trying to tackle different branches of LinkedIn’s revenue, and it’s important for LinkedIn to either move early to acquire those startups with traction, or build a competing feature set.
Connections / User. In our own study at my startup we have found LinkedIn’s social graph to be approximately ½ to 1/3 as broad as that of Facebook’s.
3) Facebook, Facebook, Facebook.
In this case, Facebook isn’t just the 600lb gorilla, it’s the entire jungle. When Facebook launched, it had the option to select “networking” as one of the three things a user is “looking for” on the service. They’ve clearly moved away from professional networking, but it wouldn’t be difficult for them to add LinkedIn’s search feature set, on top of a much more powerful social graph. As noted earlier, the lines between professional and personal use cases on social networks are being blurred, and it’s important to see if Facebook makes any moves into the space.
The Future of Organizational Charts
We’ve all taken the Management and Managing People at Work classes focused on teaching us the different ways to organize businesses.Organizational charts can get pretty fun, especially when you start talking about matrix structures….But all of these notions of organizational charts are a bit outdated. It’s one thing to define the hierarchy and reporting structure of your organization, it’s quite another to actually understand how your organization REALLY works. What you draw in your org chart and how your company really functions can be really different things…..
Organizational Charts 1.0 :
The history of corporate organizational charts dates back to David McCallum, the Superintendent of the Erie line for the New York and Erie Railroad Company in the 1850's.
“In his annual reports to the corporation’s Board of Directors, McCallum laid out the principles and organization of the first “modern” corporation in the mid-1850’s. His organization chart, which became widely adopted, laid out the fundamental structural difference between the ubiquitous “functional” organization and the emerging corporate or “multi-divisional” structure. McCallum observed that for short-haul railroads a superintendent can directly know and manage operations. But, with a rail stretching over 500 miles this is not feasible. He proposed and implemented an organization that broke the rail line into geographical divisions of a manageable size, each headed by a divisional supervisor. Divisional supervisors reported to headquarters. His Multi-divisional form of organization enabled a large business to operate as efficiently as a small one. J. Edgar Thompson at the Pennsylvania railroad quickly adopted McCallum’s idea and developed staff functions at corporate headquarters for planning and financial controls and , and to implement general business policies.” (http://www.mgmtguru.com/mgt301/301_Lecture1Page7.htm)
Organizational charts 2.0

Alfred Chandler entered the picture in the early 1900’s and continued the process of defining management hierarchy in the workplace. In his book, The Visible Hand: The Managerial Revolution in American Business, he argued that organizational charts (defining hierarchical structure), help corporations lower costs and boost productivity. From this concept has evolved the types of org charts we know today : hierarchical, line-staff, functional and matrix.
Organizational Charts 3.0 - The Networking and Connectivity Revolution
The truth is, there can be a large disparity between what an organizational chart claims and how the company actually works. Rob Cross in his book “The Hidden Power of Social Networks” makes the argument that organizations can learn a lot about the true inner workings of their organization by conducting a Social Network Analysis of their companies.
“Getting an accurate view of a network helps with managerial decision making and informs targeted efforts to promote effective collaboration. Rather than leave the inner workings of a network to chance, executives can leverage the insights of a social network analysis to address critical disconnects or rigidities in networks and create a sense-and-respond capability deep within the organization.”
Understanding and managing the connectivity within an organization is “critical to performance, learning, and innovation.” Organizational charts were born out of this principle, and today we finally have the tools in place to not only define connectivity within an organization, but to actually visualize it, and enhance it in real time. You can now know whether your Marketing Department is talking to your Sales Department, and actually act on any divisional gaps you identify....Revolutionary!
Welcome to the world of managing organizations, and enhancing collaboration, connectivity, and innovation within an enterprise....in real time.
